
- Berachain (BERA) crashes 62% post-mainnet launch, displaying trends from recently launched TRUMP and MELANIA memecoins.
- Technical indicators suggest further downside unless whale accumulation or bullish sentiment shifts market momentum.
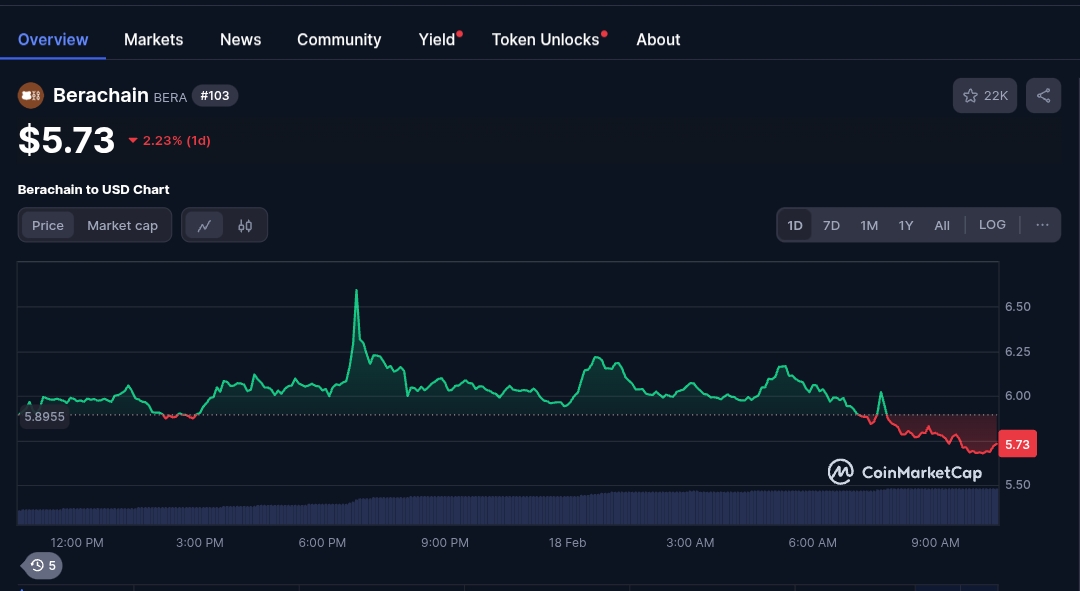
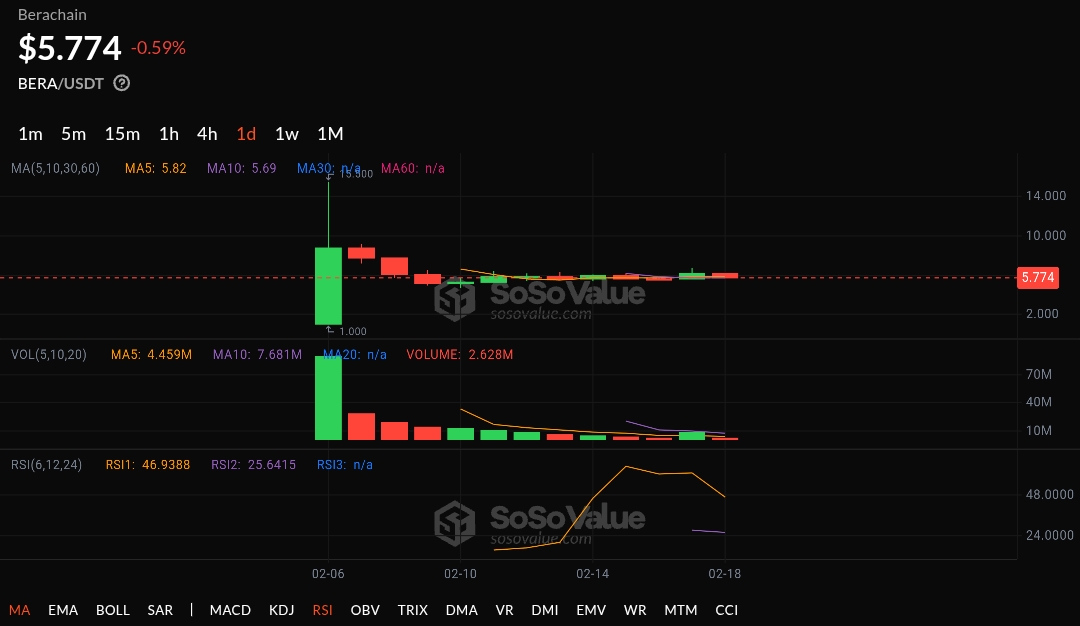
Berachain (BERA) has experienced significant volatility following its mainnet launch on February 6, 2025. The token’s price surged to an all-time high of $14.99 but has since declined by approximately 62% and is attempting to stabilize amid major sellouts. As of February 18, BERA traded around $5.73. This sharp downturn has raised concerns among investors about the token’s future trajectory.
BERA Attempts a Recovery After Post-Launch Freefall
The early rally in BERA’s price was driven by several catalysts, including a successful airdrop, major exchange listings on Binance and Coinbase, which gave it a 630% surge in 24 hours, and excitement surrounding Berachain’s Proof-of-Liquidity (PoL) consensus mechanism.
During its early campaign, a whale made a massive $589k profit after shorting $BERA with its $1.6 million investment and withdrawing $2.19 million. However, the initial hype couldn’t be sustainable as profit-taking and a liquidity squeeze forced a sharp decline.
Despite the crash, $BERA showed a slight recovery and bounced off its lows as interest in its DeFi-focused remains strong. The project is backed by over 270 committed projects and strategic partnerships, which include a LayerZero Labs collaboration. These factors have helped rekindle investor confidence, though concerns about further volatility persist.
Still, some market analysts warn that BERA’s price action resembles the post-hype crashes seen in speculative meme coins like TRUMP and MELANIA, which are linked to U.S President Donald Trump. If bearish sentiment prevails, downside projections suggest levels as low as $1.50. However, if Berachain’s fundamentals continue to strengthen, BERA could defy these bearish forecasts.
Short-Term Indicators Flash Green, But Long-Term Uncertainty Looms
From a technical perspective, BERA presents a mixed picture. Its Relative Strength Index (RSI) is around 50, which means neutrality, while the Moving Average Convergence Divergence (MACD) recently formed a bullish crossover, hinting at potential near-term gains. However, the 50-day moving average still lags behind the 200-day moving average, reinforcing caution among traders.
Key support zones lie at $5.50 and $5.00. Holding these levels could set the stage for an upward move toward the resistance zone at $6.50. A breakout beyond $7.50-$8.00 could further solidify bullish momentum. Conversely, failure to sustain support may trigger another wave of sell-offs.
While technical indicators provide insight into short-term price action, Berachain’s long-term outlook hinges on fundamental factors. Market trends, whale investment, and long-term holders might be its hope for recovery and survival.
Highlighted Crypto News for Today