
- Bitcoin drops over 7%, holding near $89K.
- BTC’s daily trading volume has spiked by 197%.
- $648.98M in BTC liquidations hit the market.
The largest crypto asset, Bitcoin (BTC), has been navigating through a narrow bridge for the last few weeks. BTC has come up short in escaping the consolidation phase. BTC has been trading below $100K since February 4, facing rejections despite multiple recovery attempts.
Bitcoin’s price has lost over 7.02%, crashed below $90K, slipping through critical support ranges, extending its downturn amid President Donald Trump’s anticipation of US tariffs on Mexico and Canada starting on March 4.
The uncertainty over the impending tariffs led many investors to reduce exposure to risky bets, causing the cryptocurrency market to plunge by over 7.35% to $2.88 trillion.
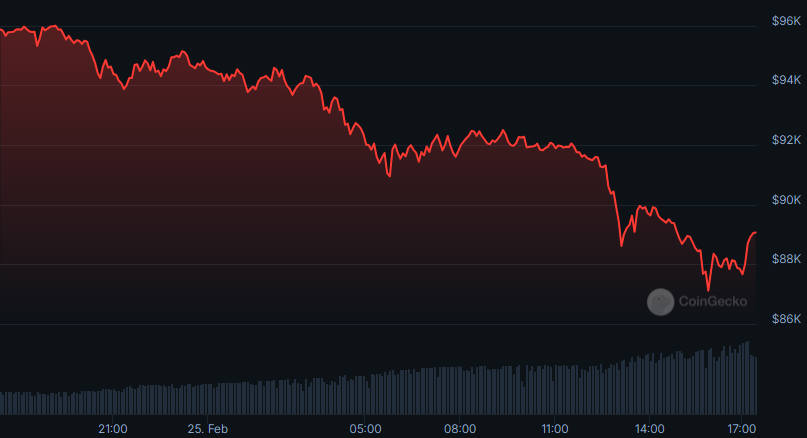
The asset opened the day trading at $96,087, and the emergence of bears took the price down to the $86,873 range. At press time, Bitcoin traded at $89,040. Consequently, BTC has stepped into the fear zone as the Fear and Greed Index rests at 25.
During this timeframe, the market has witnessed a 24-hour liquidation of $648.98 million worth of Bitcoin. Notably, the daily trading volume of the asset has reached $75.04 billion.
In addition, Ali’s chart highlights that Bitcoin is breaking below a key parallel channel, signalling increased bearish pressure. If it fails to reclaim the $92,500 level soon, the downward momentum could push prices toward $81,000.
Will BTC Bears Push Prices Lower?
The market crash caused Bitcoin prices to enter bearish territory, and the selling pressure remains dominant. If sellers continue to take control, BTC could retest the $87,257 support. Failing to cross over the level would put additional pressure, extending the correction of BTC.
Assuming the market trend shifts and the buying pressure gains momentum, Bitcoin could move to the initial resistance at the $88,460 range. In the case of a golden cross formation, BTC could climb to test higher, nullify the negative trend, and witness a resurgence in demand.
The Moving Average Convergence Divergence (MACD) line and signal line of BTC are settled below the zero line. This indicates a strong bearish crossover with selling pressure outweighing buying interest. If this momentum holds, further declines could follow.
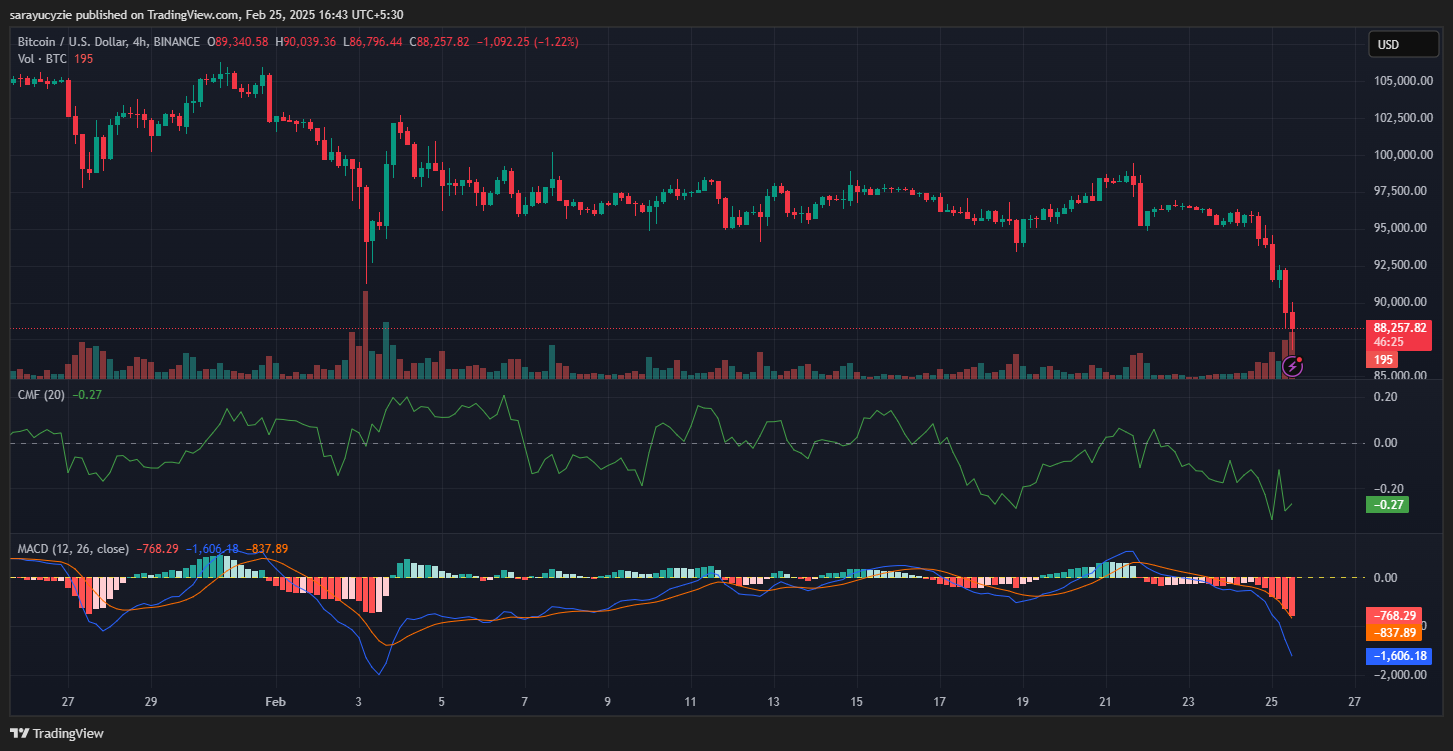
Moreover, the Chaikin Money Flow (CMF) indicator positioned at -0.27 signals that the capital is flowing out of the asset. Sustained selling pressure strengthens the chance of an extended loss. Meanwhile, the daily trading volume of BTC has increased by over 197%.
Bitcoin’s Bull Bear Power (BBP) value of -9,163 points out a strong bear dominance, that sellers are in control and pushing prices lower. Besides, the daily relative strength index (RSI) found at 18.75 suggests extreme oversold conditions. This could point to a potential bounce.