
- Solana is trading at $204, up 1.18% in the last 24 hours, with a slight pullback after reaching $205.
- Solana’s ascending triangle pattern signals a potential breakout toward $565, aligning with historical Fibonacci-based rallies.
The crypto market displays signs of recovery as the overall market cap and the 24-hour trading volume surges to $3.19 trillion and $105 billion, respectively as per data from CMC. As the market recovers, major altcoins such as Solana are reversing the recent downtrends, indicating a potential rally.
At press time, Solana is trading at $204, up by 1.18% in the past 24 hours as per data from CMC. The altcoin opened its trading session at $194, and the bull elevated the price to $205, where it faced a rejection, leading to a slight pullback.
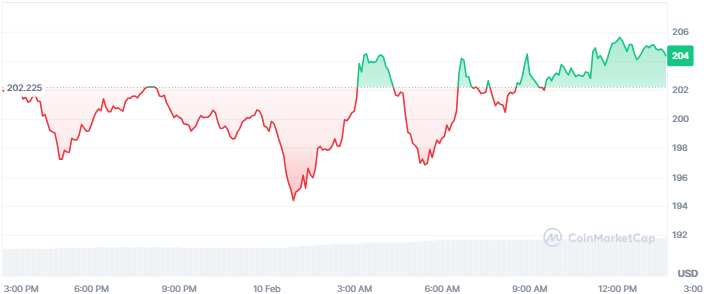
Amidst the bullish recovery, Solana is up by 1.60% and 10% on the weekly and monthly charts, respectively. In addition, its market cap and trading volume have climbed to $99.57 billion and $4.02 billion, respectively.
Solana Eyes $565 as Ascending Triangle Signals Breakout
According to crypto analyst Trader Tardigrade, Solana has consistently formed ascending triangles before major breakouts. It can be observed from the chart that each breakout has risen up to the Fibonacci level of 2.618 before retracting. The current pattern resembles this scenario, and there is a potential for a bounce now.
#Altseason #Solana$SOL has been forming Ascending Triangles before each recent BREAKOUTS.
— Trader Tardigrade (@TATrader_Alan) February 9, 2025
Every breakout reaches its target at Fibonacci 2.618 🔥
The current ascending triangle is more than halfway complete.
A breakout is expected soon, with a target set at $565 🚀 pic.twitter.com/ccQyRuauyk
The price history depicts the SOL coming out of such formations with high accuracy of hitting Fibonacci levels. The current formation of an ascending triangle is more than halfway, thus we could potentially see a breakout in the near future. If Solana continues with the previous pattern, the altcoin is projected to hit $565.
The Fibonacci 2.618 level is still a key level from the previous bullish move. Such a breakout can propel Solana further up and technical analyses indicate the possibility of further gains.
Will the Bullish Momentum Break Key Resistance Levels?
Technical indicators on the daily chart point to a bullish momentum in the Solana market as it reverses from the recent downtrend. A series of green candlesticks have formed, indicating a potential rally.
The support at the $175 region has been holding strong, and Solana’s upward journey could be ready to challenge the resistance at the $220 mark. Should Solana clear this resistance, the altcoin could be set for a new rally toward the key resistance at the $240 region.
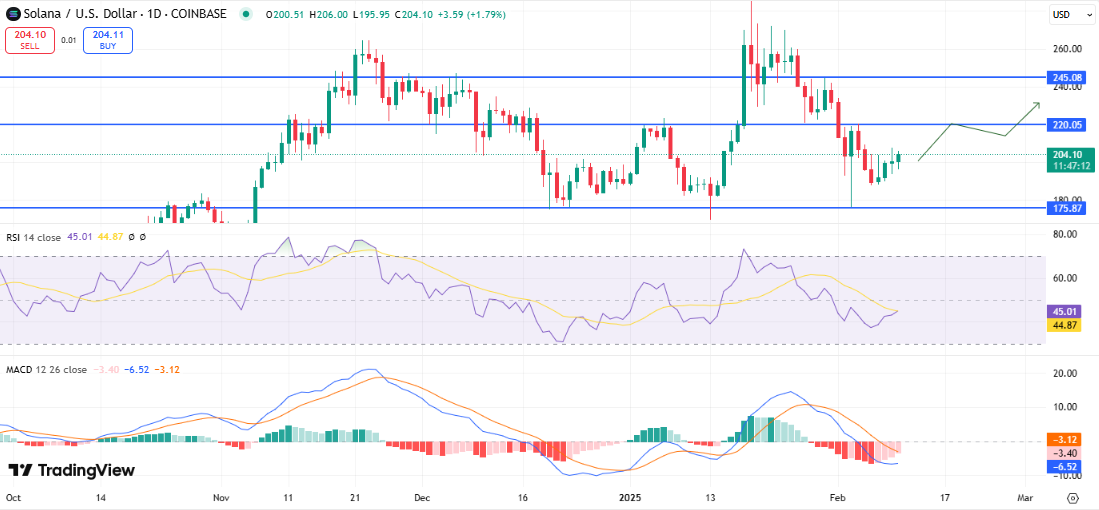
Indicators such as the Moving Average Convergence Divergence (MACD) and Relative Strength Index (RSI) support Solana’s upward rally. The MACD indicator shifts from the negative territory as the red bars fade from the histogram. Moreover, if the current trend holds, the MACD line, which has changed its downward direction, will likely make a bullish crossover soon.
Furthermore, the RSI is trending upwards from the oversold region, suggesting an increase in buying pressure. At 45 indexes, the RSI has room for further growth which could likely lead SOL to break past this resistance level.
Highlighted Crypto News
TAO Surges 7% Today, Can Bittensor Withstand Market Fluctuations?