
In Amp Coin (AMP) Technical Analysis 2021, we use past statistics, price patterns, RSI, and various other AMP information to analyze the future trend of cryptocurrencies.
AMP, formerly known as Flexacoin, is an adapted version of a cryptocurrency used as a secure asset. The purpose of development is to collateralize retail payments on the Flexa network.
AMP helps to reduce the burden of crypto payments between customers and merchants using fiat or cryptocurrency to ensure the credibility of merchants when accepting user payments. This type of cryptocurrency is mainly used for business-to-business transactions because funds are temporarily protected during the transaction processing waiting for the blockchain to confirm. In this way, AMP acts as an insurance policy to notify buyers and sellers that cryptocurrency transactions are in progress. AMP is an ERC20 Ethereum token.
Amp Coin (AMP) Current Market Status
According to CoinGecko, the AMP price is trading at $0.05 with a 24-hour trading volume of $23,211,543, at the time of writing. However, AMP has decreased by 5.7% in the last 24 hours.
Moreover, AMP has a circulating supply of 48,006,805,913 AMP. Currently, AMP trades in Coinbase Exchange, ZB.COM, Gate.io, Bilaxy, and Uniswap (V2).
Amp Coin (AMP) Technical Analysis 2021
The recent development and upgrades might push Amp Coin (AMP) to reach new heights. Now, let’s deep dive into the AMP technical analysis 2021. The daily time frame chart of Amp (AMP) as shown below.

The inverted head and shoulders pattern used as an indicator. This pattern is related to the reversal of the downward trend in prices. This is one of the most common signs of reversal. When the price drops, it will hit a bottom (trough), and then start to recover and rise. Market resistance pushed it back to another trough.
The price fell to the point where the market could not maintain a lower price, and the price began to rise again. Again, market resistance pushed prices down, and prices fell for the last time. If the market cannot support the lower price, the previous low will not be made. This will trigger a higher low before the price rises again. This movement produces three valleys or troughs called the left shoulder, the head, and the right shoulder.
In the above chart, two rallies or pullbacks occur during this pattern. One occurs behind the left shoulder and one behind the head. The high points of these pullbacks are connected to a trendline extending to the right. This trendline is called the neckline or resistance line.
Amp Coin (AMP) RSI, RVOL, and MA
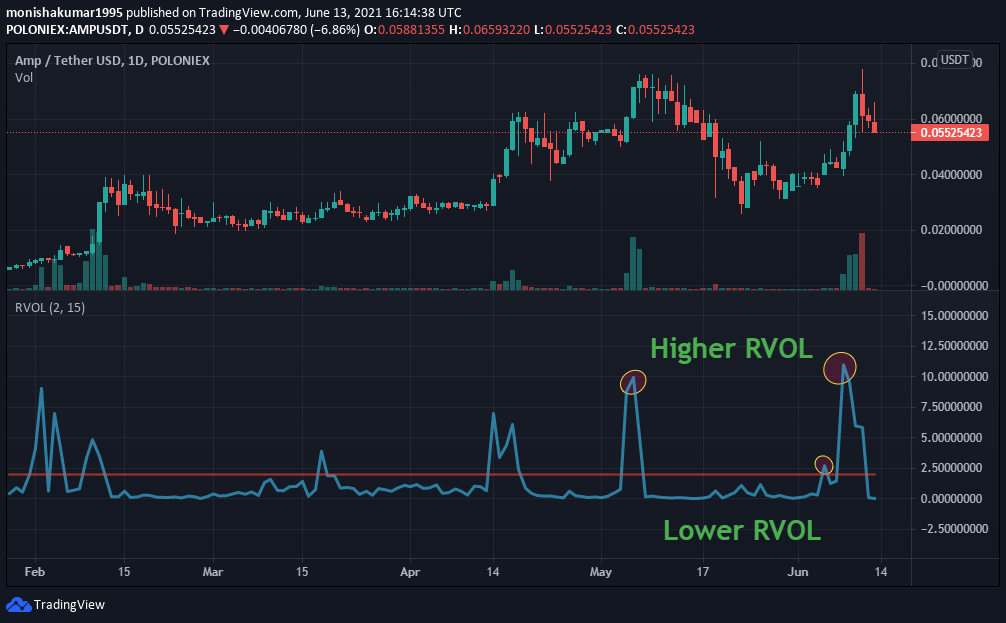
The below chart shows the Relative Volume (RVOL) of AMP. Generally, Relative trading volume is a trading indicator, which is mainly used by day traders and compares the current trading volume with the usual trading volume in the past. Notably, in the past days, it is found that the RVOL stays two times above the cut-off line making a Higher RVOL. Currently, the RVOL stays below the cut-off line which indicates the Lower RVOL.
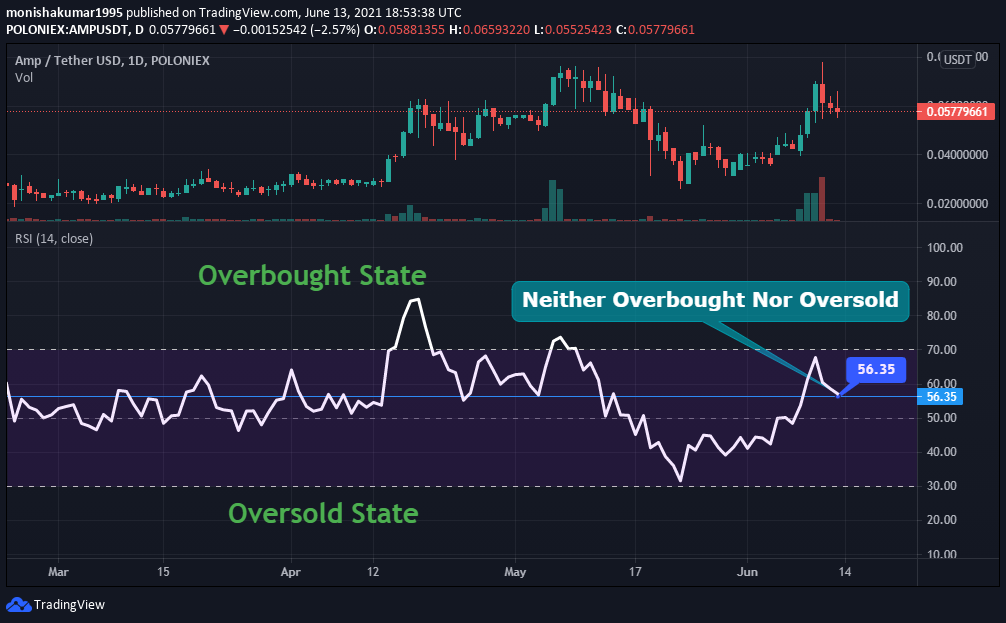
Now let’s look at the relative strength index (RSI) of AMP. As shown in the below chart, RSI remains at 56. This shows that AMP’s price is in a neither overbought nor oversold state. However, this indicates that traders can trade without any fear.
AMP’s Moving Average (MA) and Exponential Moving Average (EMA) as shown in the chart below. MA is also part of technical analysis that helps traders find trends. While EMA is a type of moving average.
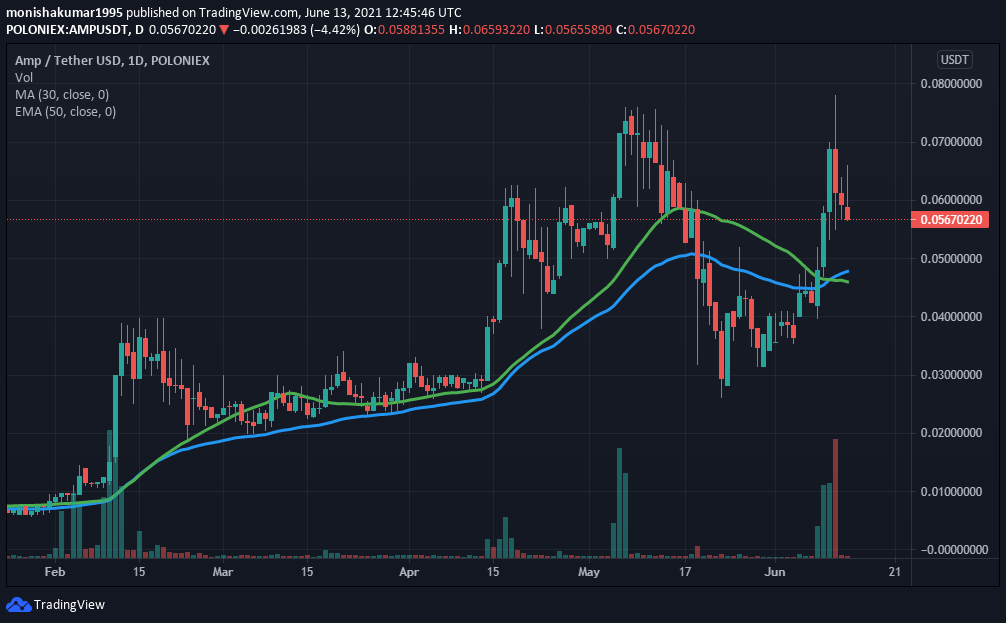
From the beginning of 2021, it is clear that the AMP price has shown many bullish patterns. Furthermore, taking all these into account, AMP could have a competitive market in 2021.
Conclusion
With the ongoing developments and upgrades that are taking place within the AMP platform. The cryptocurrency AMP has a fantastic future ahead in this crypto market. However, it is possible to see AMP reaching new heights.
Bullish AMP price prediction 2021 is $0.1. As said above, it may reach great heights, however reaching $0.6, if investors have decided that AMP is a good investment in 2021.
FAQ
Amp is built on the Flexa network and aims to provide fast and secure payments to merchants all over the world. In addition, Amp supports any digital or physical value transfer and remains decentralized and open source. Its native coin is AMP.
AMP is listed on many cryptocurrency exchanges that include Coinbase Exchange, ZB.COM, Gate.io, Bilaxy, and Uniswap (V2). It is available for trading against crypto fiat coins, stablecoins, and other cryptocurrencies.
With the ongoing developments and upgrades within the AMP platform, it has the high possibility of reaching its ATH soon.
Disclaimer: The opinion expressed in this chart solely author’s. It does not interpreted as investment advice. TheNewsCrypto team encourages all to do their own research before investing.