The entire crypto market has crashed and is facing a deep pitfall in trading where most of the cryptocurrencies are depicted in red charts. Major crypto-tokens are registering huge sell-offs while Bitcoin almost touched the $32k level. Like Bitcoin, TRON is also facing a bearish pattern for the past week and has now begun to show an uptrend.
According to the short-term time frames, the structure of TRON’s trading chart shows a bearish signal. On the other hand, TRON is about to cross its next resistance level at $0.0559 within the near term. Moreover, as per the trading pattern, the recent high is set at $0.0575 and the lower low is set at $0.051.
Significantly, TRON depicts that the price action has moved from $0.072 to $0.051 within a week. This clearly marks the recovery level at $0.056 where this also acts as resistance to price. The area between $0.048 and $0.055 has operated as a demand zone over longer periods. As a result, it’s possible that TRX will take another dive between $0.048 and $0.051.
Will TRX Take A Downtrend?
On the other hand, Bitcoin also jumped from its bearish level at the time of publication while not sure about another fall. Thus, the $0.056 zone for TRX may provide possibilities to sell or initiate short positions. Let’s take a look at the Chain Money Flow indicator to see if it predicts a bullish or bearish pattern.
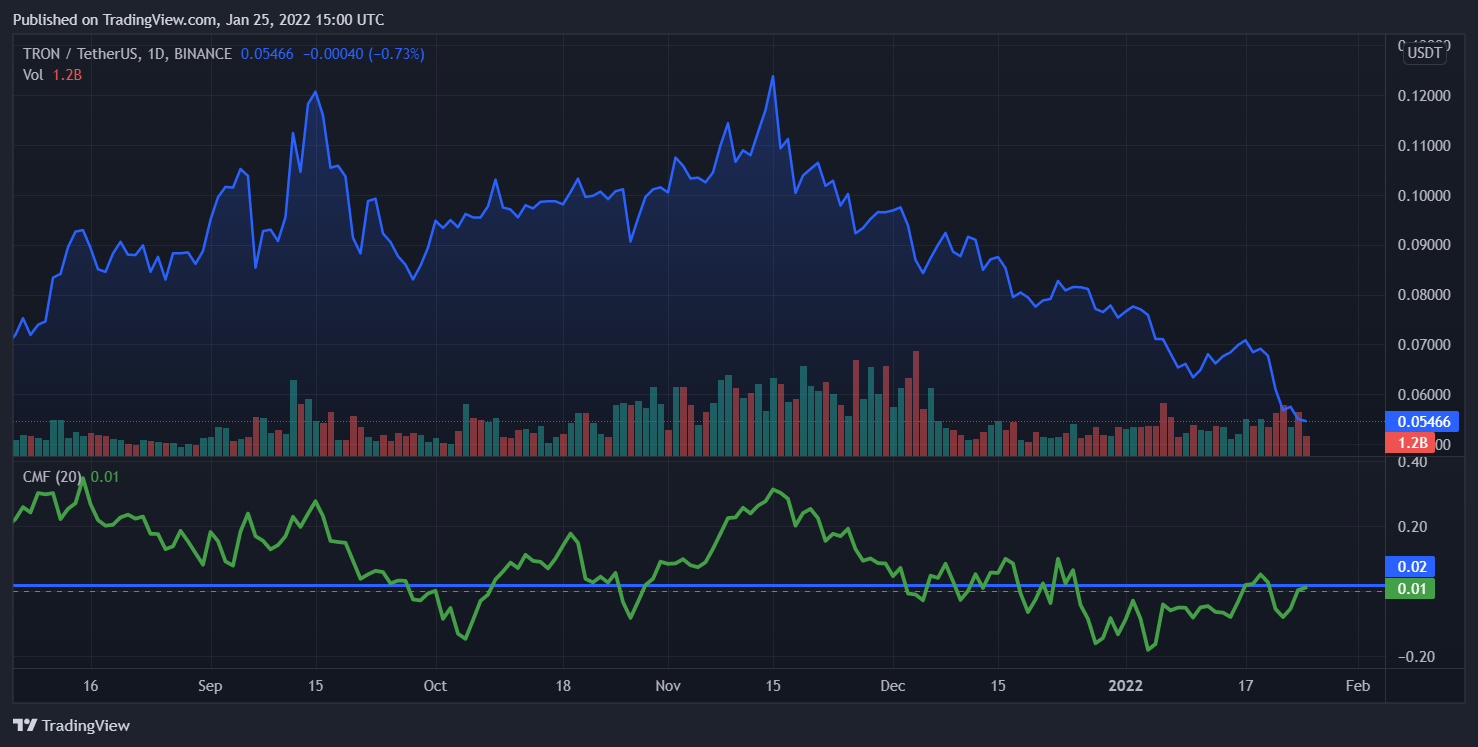
At the time of writing, TRX was trading at $0.054 while the Chaikin Money Flow indicator began to rise. Besides, the indicator was inconsistent in terms of capital flow direction. The CMF falls below 0.05, which will be more evidence that TRX is sloping downwards. If the CMF continues to surge up along with the Awesome Oscillator (AO), then the structure has a chance of displaying bulls.
Furthermore, the trading charts of TRX depict bearish signals for an hourly chart and higher time-period charts as well. Thus, it is possible that the price will dip to $0.048 with sell-offs. On the other hand, if it moves above the resistance level at $0.057 then it indicates a bullish outlook for TRX.