In Cardano (ADA) Technical Analysis 2021, we use past statistics, price patterns, RSI, and much other information about ADA to analyze the future movement of the cryptocurrency.
Cardano is a third-generation public blockchain and DApp development platform3. More so, the platform has gained attention from international media as the first blockchain to include peer-reviewed research. ADA is the native token of Cardano. ADA is one of the top crypto in the market. It has recently reached a new ATH of $1.83, on May 09, 2021.
Third-generation cryptocurrencies learn the lesson from Bitcoin and Ethereum and improve upon their shortcomings. However, the third generation cryptos such as ADA use new developments such as layered design to improve scalability, security, and sustainability. In this way, they develop more usefulness, address flaws, and rectify inefficiencies.
Cardano (ADA) Current Market Status
According to CoinGecko, the Cardano price is trading at $1.72 with a 24-hour trading volume of $7,048,653,997, at the time of writing. However, ADA has decreased by -1.7% in the last 24 hours.
ADA holds 7th position on CoinGecko right now. Moreover, ADA has a circulating supply of 32,066,390,668 ADA and maximum supply of 45,000,000,000. Currently, ADA trades in Binance, Huobi Global, OKEx, FTX, and CoinTiger.
Cardano (ADA) Technical Analysis 2021
The recent development and upgrades might push Cardano (ADA) to reach new heights. Now, let’s deep dive into the Cardano (ADA) technical analysis 2021.
ADA Showing Descending Scallop Pattern in Hourly Time Frame
The hourly time frame chart below shows the Cup with Handle pattern of Cardano (ADA).

Based on the graph above, the chart displays a cup and handle pattern. The pattern represents a period of consolidation which might result and reach an immediate price breakout or breakdown. A breakdown from the lower line represents the start of a new bearish signal, while a breakout from the upper line indicates the start of a new bullish signal.
In addition, at the beginning of this pattern, ADA moved from its bullish to a bearish trend. This happens as many traders stop buying and start to sell. As a result, the ADA trading volume decreased drastically.
Cardano (ADA) RSI, MACD, MA, and EMA
The below chart shows the Moving Average Convergence/Divergence (MACD) of ADA. Notably, the MACD (blue) continues to stay just above the signal indicator (orange line). This means that cryptocurrency traders can still expect more bullish days ahead.
In contrast, if the MACD starts to move below the signal indicator and performs a bullish crossover. Then the crypto has a high possibility of reaching new lows.
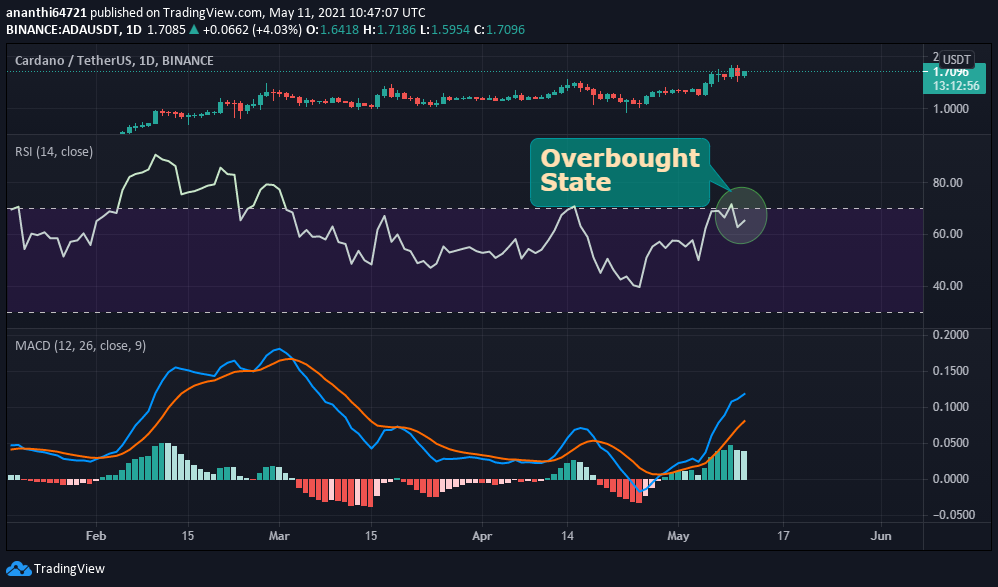
Now let’s look at the relative strength index (RSI) of ADA. As shown in the chart above, the RSI remains at level 67. This shows that ADA price is in nearly overbought state. However, this gives confidence for the traders to trade without any fear.
ADA’s Moving Average (MA) and Exponential Moving Average (EMA) is shown in the chart below. Moreover, MA is a part of technical analysis that helps traders to recognize trends. While EMA is a type of moving average.
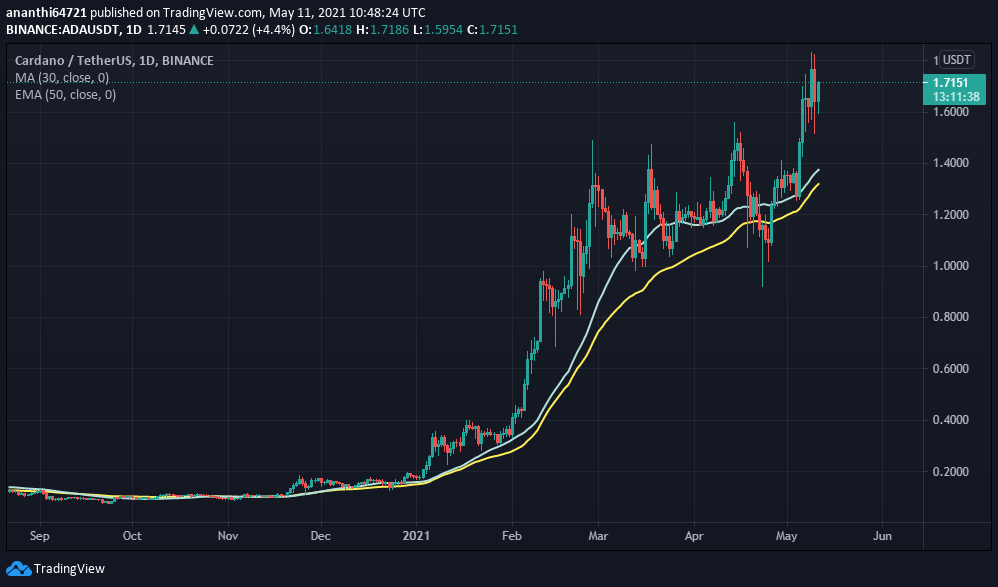
From the beginning of 2021, it is clear that the ADA price has shown many bullish patterns. Furthermore, taking all these into account, ADA could have a competitive market in 2021.
Cardano (ADA) Showing Measured Move Up Pattern in Monthly Time Frame
In the monthly time frame chart below, we can see the measured move up pattern. Usually, this is followed by an uptrend. But this can be followed by a downtrend also.
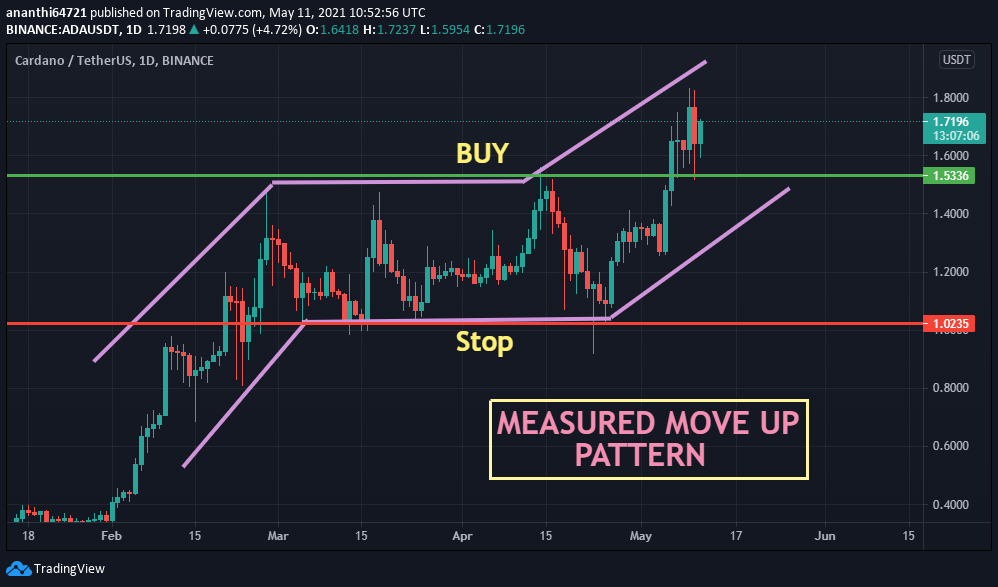
The above chart shows the bullish Measured Move Up pattern. It is a three-part formation that starts as a reversal pattern and ends as a continuation pattern. However, the Bullish Measured Move includes reversal advance, a correction/consolidation, and a continuation.
Conclusion
With the ongoing developments and upgrades that are taking place within the ADA platform. The cryptocurrency ADA has a fantastic future ahead in this crypto market. However, it is possible to see crypto reaching new heights.
Bullish ADA price prediction 2021 is $2. As said above, it may reach great heights, however reaching $5 if investors have decided that ADA is a good investment in 2021.
FAQ
What is Cardano (ADA)?
Cardano is a third-generation public blockchain and DApp development platform. It’s native token is ADA.
Where can you purchase ADA?
ADA is listed on many cryptocurrency exchanges that include Binance, Huobi Global, OKEx, FTX, and CoinTiger. In which the crypto is available to be traded against fiat currencies, stablecoins, and other cryptos.
Will ADA reach a new ATH soon?
With the ongoing developments and upgrades within the ADA platform, it has the high possibility of reaching its new ATH soon.
Disclaimer: The opinion expressed in this chart solely author’s. It does not interpreted as investment advice. TheNewsCrypto team encourages all to do their own research before investing.
Recommended for You